As more organisations embrace data-driven practices, platforms like Microsoft Power BI are proving invaluable in enabling businesses to generate and leverage business intelligence more efficiently.
Despite the impact of COVID-19 on businesses around the world, IDC notes the Big Data and analytics (BDA) market grew beyond expectations in 2020. In Europe alone, IDC forecasted spending on BDA solutions would reach $50 billion by the end of 2021. The forecast also shows that BDA spending will continue to increase over the next five years at a compound annual growth rate (CAGR) of 11%, with growth driven by organisations recovering from the impact of COVID.
This confidence in analytics and business intelligence solutions boils down to a need to reduce uncertainty. Data enables businesses to:
- Improve their situational awareness
- Identify and mitigate risks and threats
- Improve their use of limited resources
- Create contingency plans for disruptive events.
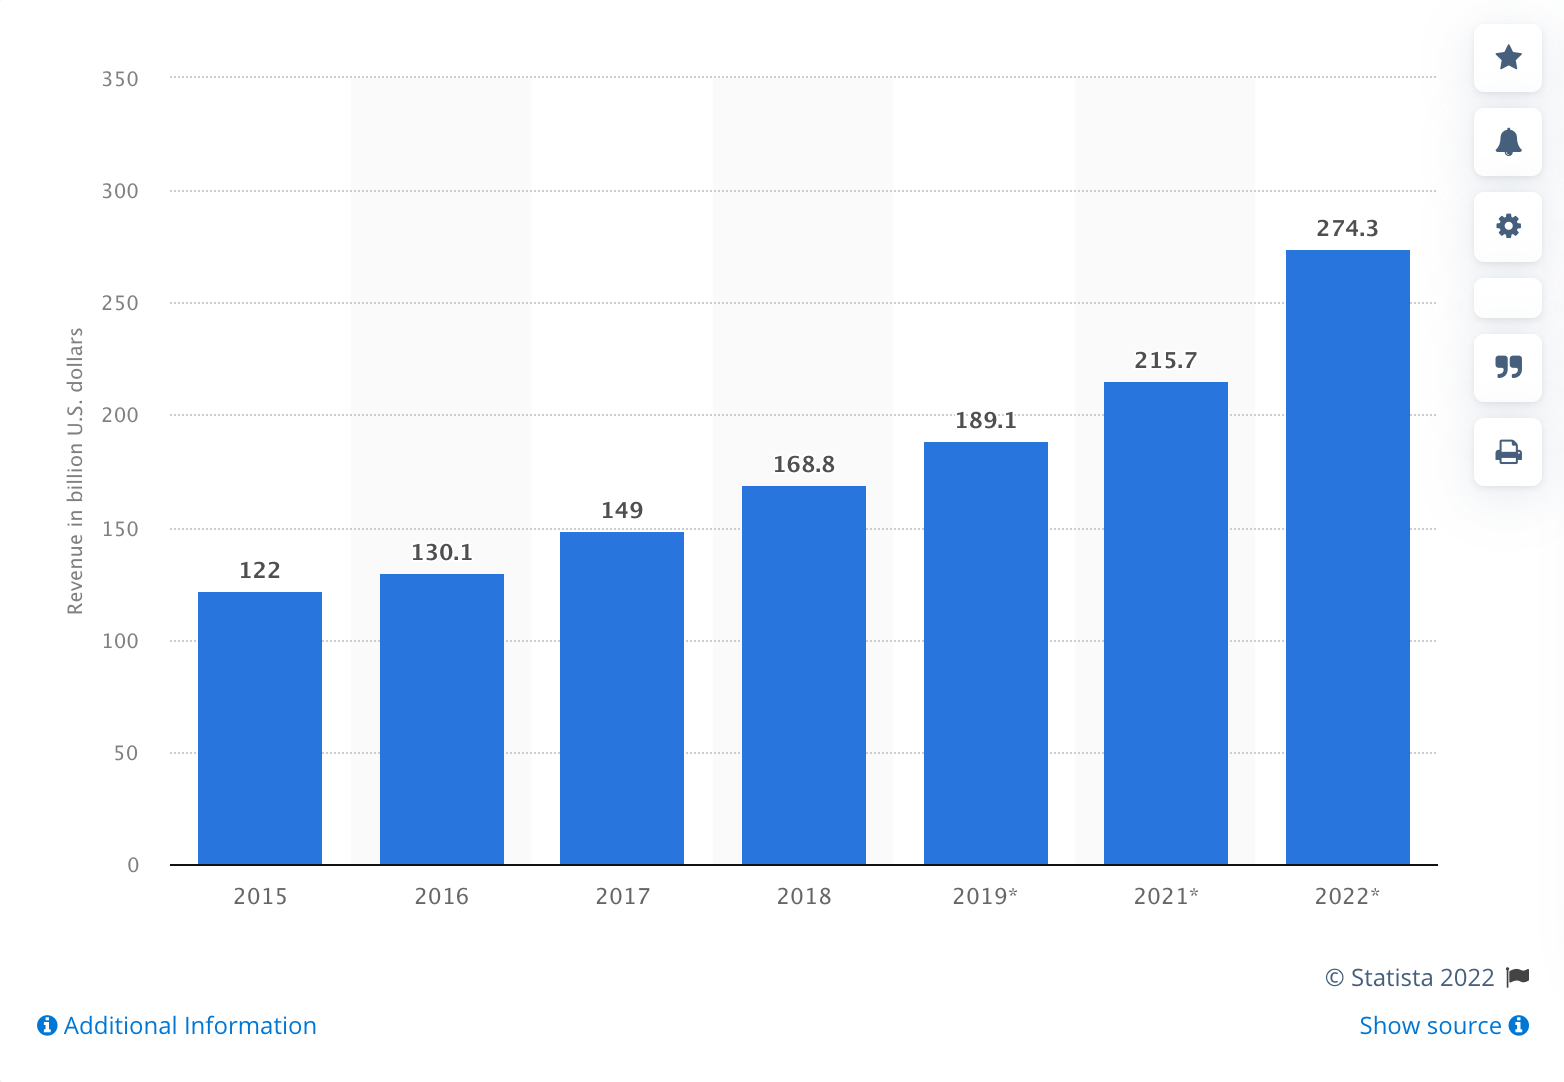
Above all, the tactical use of data and business intelligence is the key to generating revenue amidst periods of instability. Research from Statista shows the BDA market is on pace to generate $274.3 billion this year.
Of course, all this begs the question: which analytics and business intelligence tools should your business consider? The BDA market is saturated with all kinds of tools and platforms, but Microsoft Power BI stands out as a trusted name for several reasons.
WHAT IS MICROSOFT POWER BI?
Microsoft Power BI is an interactive ecosystem of software, services, apps and connectors that function in harmony to gather data from disparate sources and transform it into coherent, visualised business intelligence. Data can come from spreadsheets, a collection of cloud-based tools and services (e.g., Salesforce) and on-premise data sources.
Related Reading: The Beginners Guide: What Is Microsoft Power Bi?
Power BI comprises three primary components:
- Power BI Desktop: This is Power BI’s desktop application (available only on Windows).
- Power BI service: Also known as Power BI online, this is Power BI’s Software as a Service (SaaS) component and offers dashboards to help you keep a pulse on your organisation’s core metrics and KPIs.
- Power BI mobile: This component covers the apps for Windows, iOS, and Android devices.
By connecting data sources and visualising metrics and key performance indicators (KPIs), Power BI provides an all-in-one solution for data integration, data processing and data presentation.
In this Power BI for beginners guide, we dive into six reasons to use Microsoft Power BI as your analytics and business intelligence platform.
6 REASONS TO USE MICROSOFT POWER BI?
At Optimising IT, we believe Power BI is the best platform for making sense of your data and transforming it into actionable business intelligence. Here’s why:
1. OFFICE 365 INTEGRATION
If your business is already deep in the Office 365 ecosystem, it makes perfect sense to maximise your investments in Office by adopting Power BI.
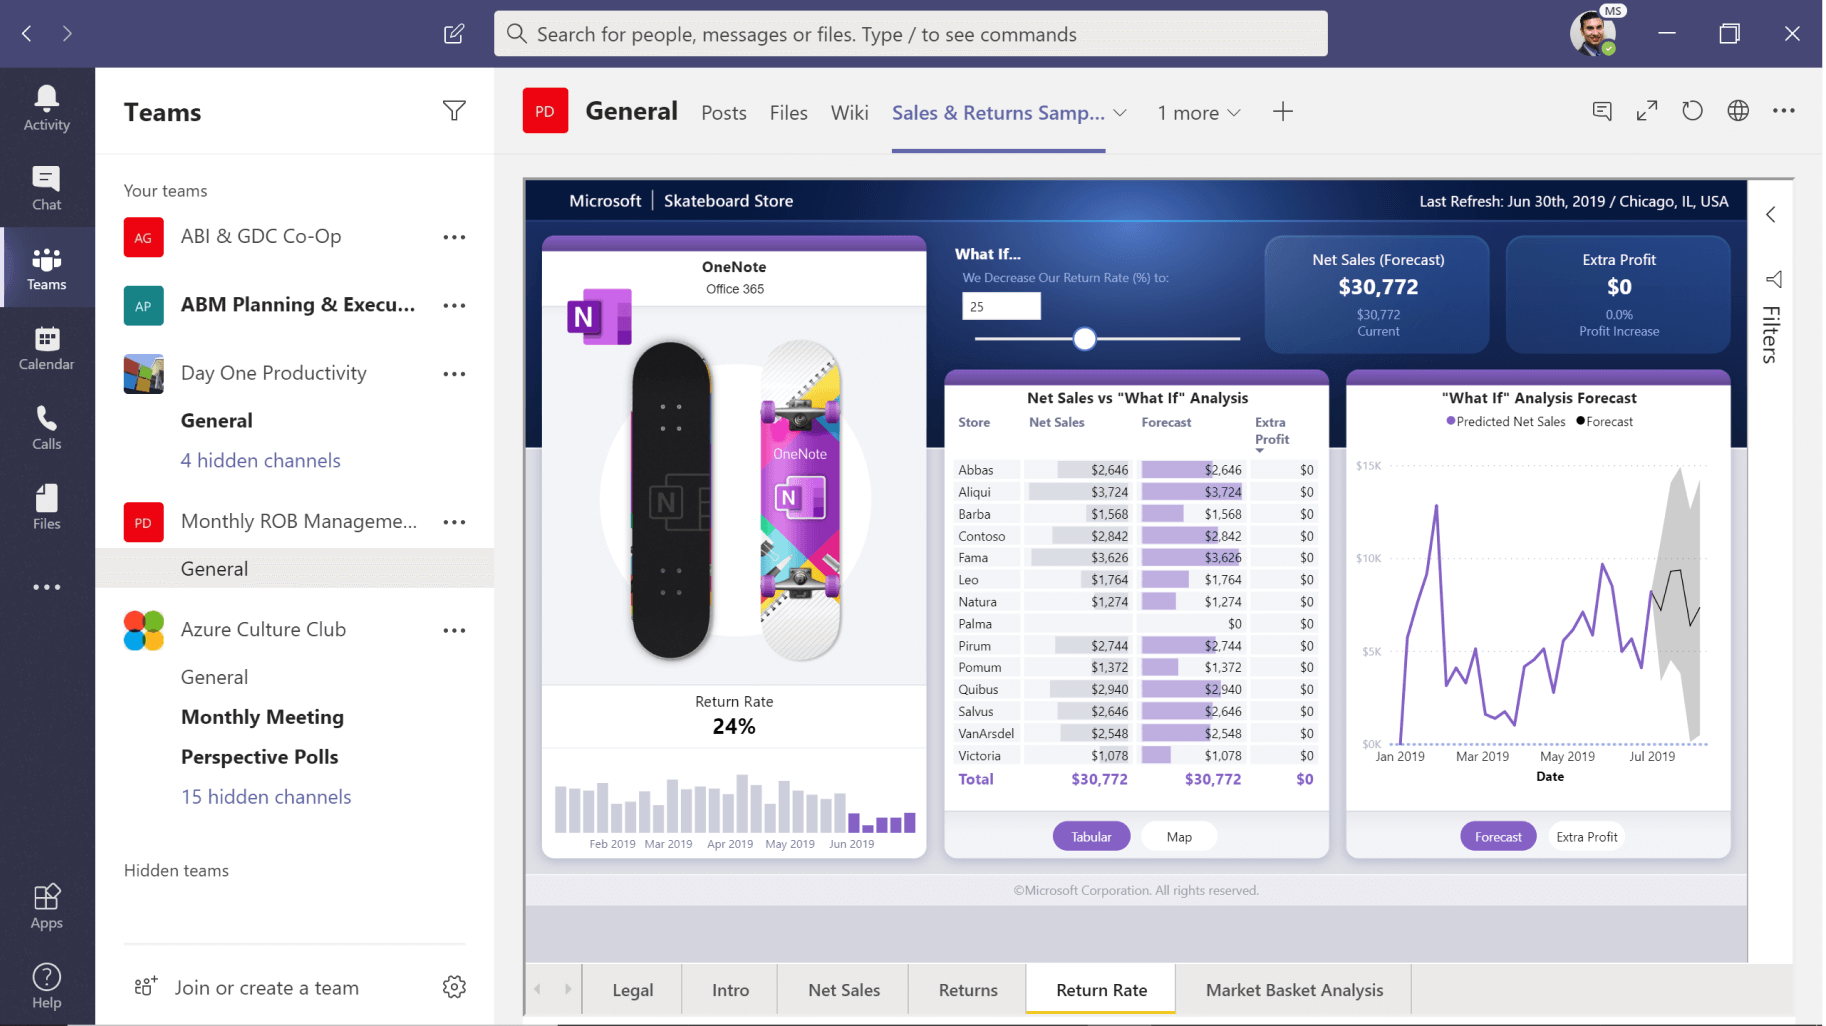
Power BI’s integrations with Office unlock opportunities to see data insights within the Office tools you’re already familiar with. For example, Power BI allows you to add interactive reports to conversations on Microsoft Teams, making collaboration and decision-making faster. Likewise in Excel, users can view datasets that have the interactive features of Power BI reports.
Related Reading: Fortify Your Office 365 Defences
2. CONNECT DATA FROM A WIDE ARRAY OF SOURCES WITH EASE
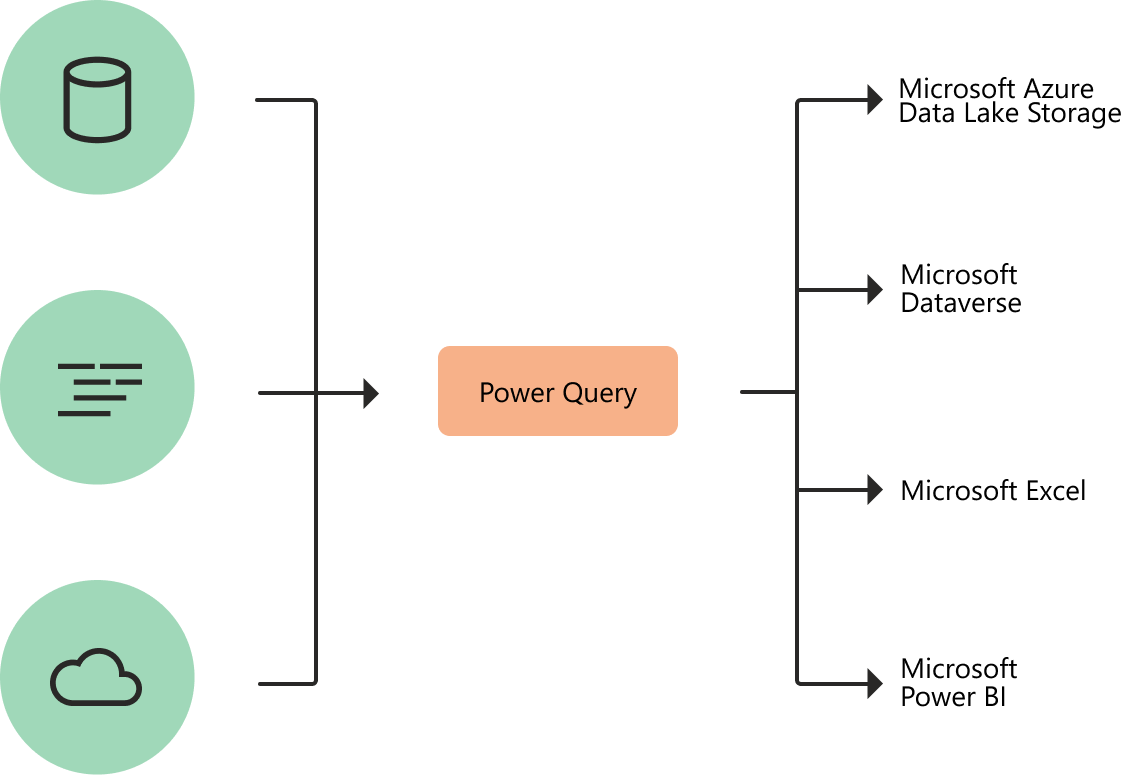
Power Query, Microsoft’s data connectivity and integration technology, enables Power BI to access your business data from hundreds of different data sources and present it according to your needs. This process is quick and does not require any coding experience.
Power Query supports over 70 connectors, allowing you to load data from cloud-based platforms such as Azure, Salesforce, Marketo, Google Analytics and more, as well as spreadsheets, CSVs and on-premises SQL databases. These connectors make it possible to load Power BI dashboards and analyse datasets in real-time.
3. FASTER TIME TO INSIGHT, TIME TO ACTION AND TIME TO DEPLOYMENT
Power BI also integrates with three other Microsoft Products — Power Apps, Power Automate and Power Virtual Agents — to form Microsoft Power Platform.
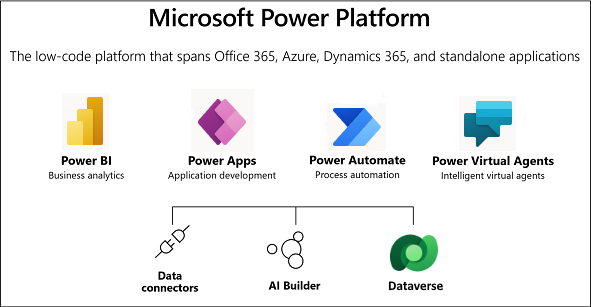
Each app is designed to do one thing well. But when combined, Power Platform enables your organisation to speed up:
- Time to insight (TTI)
- Time to action (TTA)
- Time to deployment (TTD).
In other words, Power Platform makes it faster and easier to collect data and turn it into actionable insight, translate that insight into action, and use that action to deploy an app or solution to testing or production.
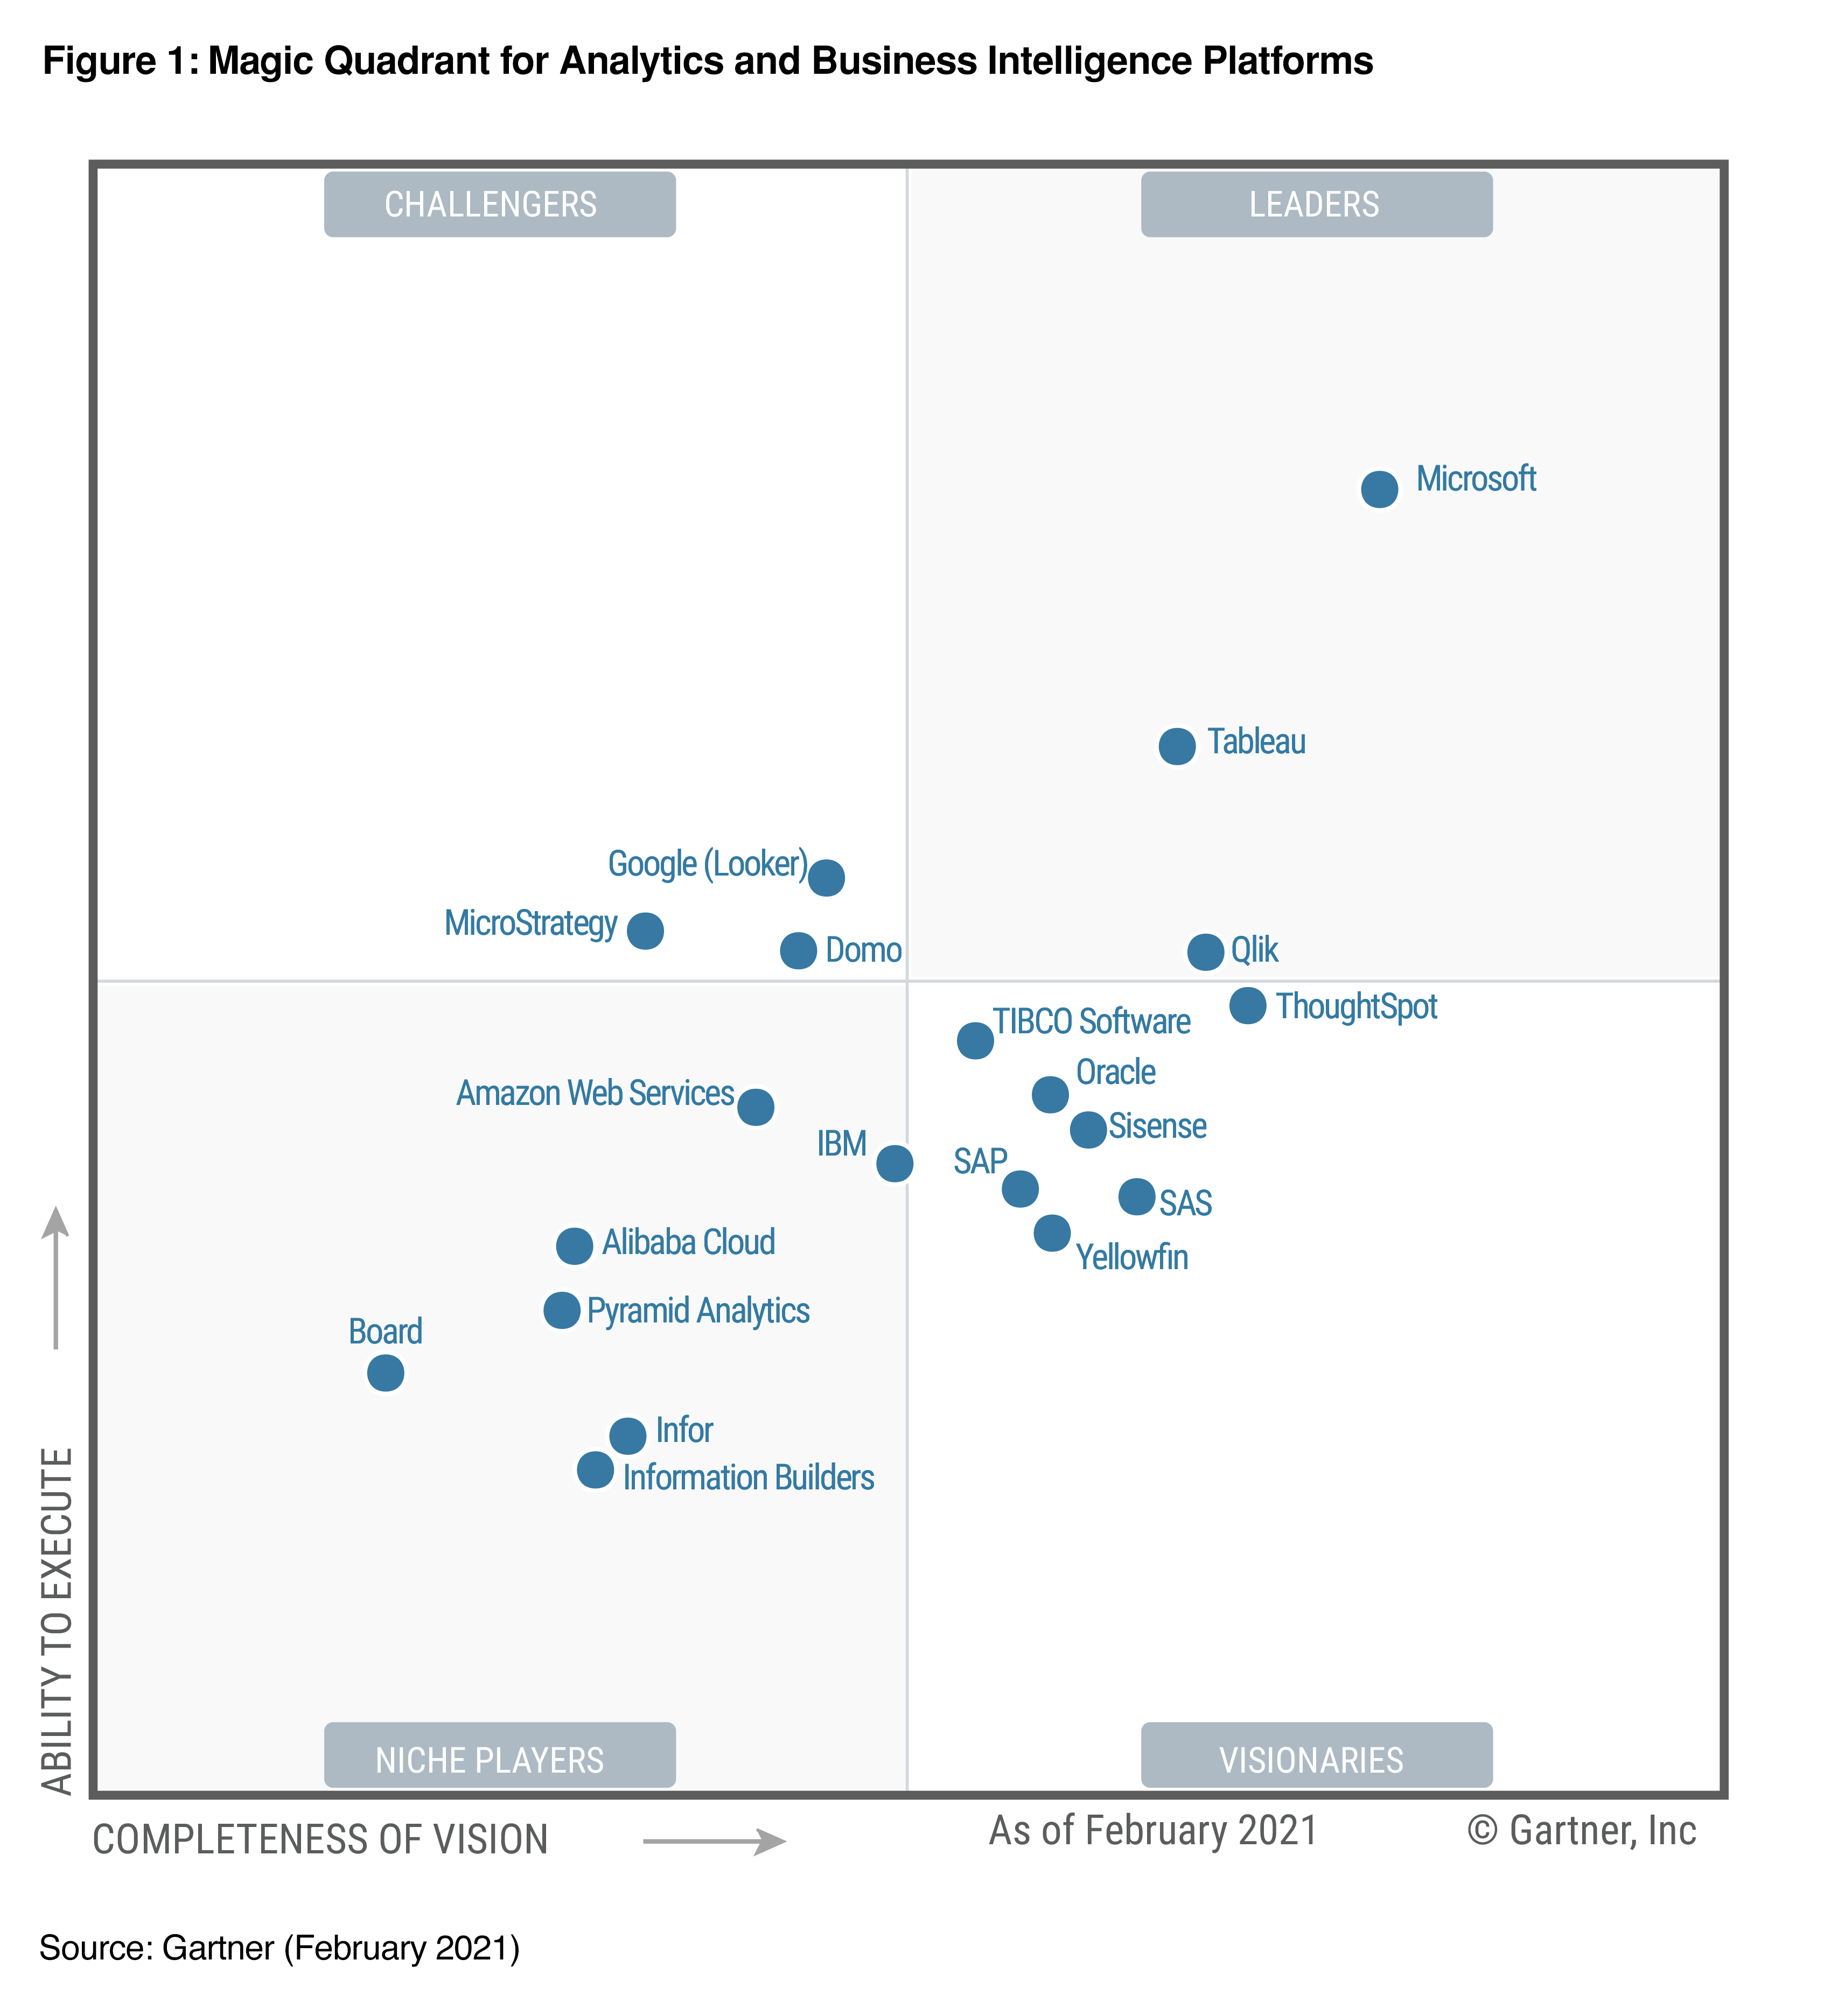
4. POWER BI IS A LEADER IN ANALYTICS AND BUSINESS INTELLIGENCE
For 14 straight years, Gartner has identified Microsoft as a Magic Quadrant Leader in analytics and business intelligence platforms. In 2021, Power BI was recognised for leading the market in terms of completeness of vision and ability to execute — beating out other leading competitors like Tableau and Qlik.
5. ACCESSIBLE INSIGHTS WITH NO CODE EXPERIENCE REQUIRED
The beauty of Power BI is that practically anyone can use it for data analysis and understand how it visualises data. While a basic understanding of KPIs and metrics is required to use the platform, you don’t have to be a data scientist or analytics professional to conduct data analysis and generate reports.
Power BI scales with your level of expertise. If your knowledge of analytics is limited to basic reports, Power BI can produce quick explanations of charts and graphs. If you’re a power user, Power BI can drill down to specific datasets and use automation to generate smart analysis.
6. DATA VISIBILITY AND ANALYSIS ON THE GO WITH POWER BI MOBILE
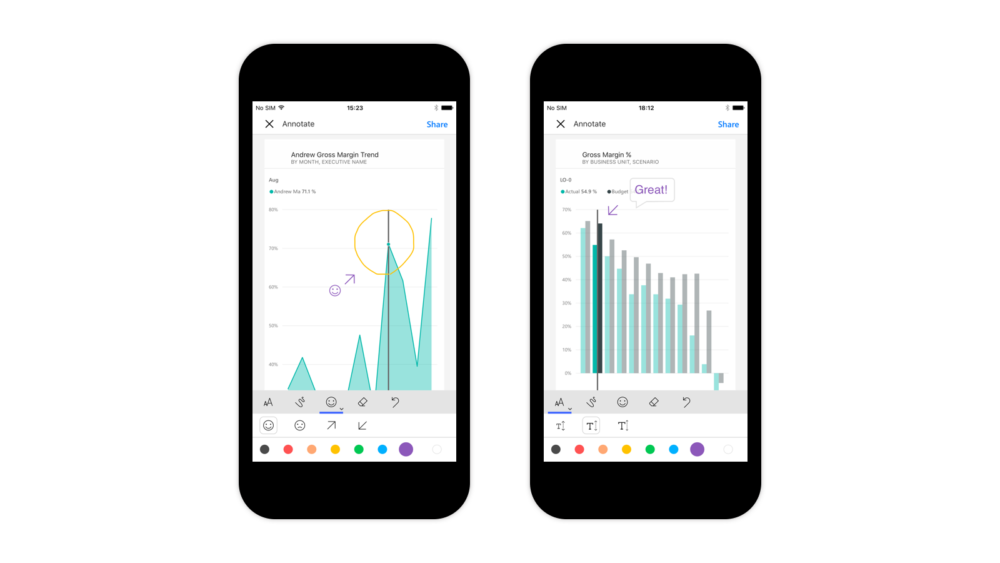
Your Power BI dashboards can go anywhere you go through the official Power BI mobile app, available on iOS, Android and Windows 10 devices. Users can access and view live dashboards and reports on any device through the Power BI mobile app. Get push notifications for alerts and use Face ID or Touch ID on your iOS device to keep your data secure.
UNLOCK ACTIONABLE BUSINESS INTELLIGENCE WITH POWER BI
Data analytics and Big Data can sound like corporate buzzwords, but as anyone involved in the digital transformation of their business will tell you, data is critical to stay agile and ahead of the competition. And as COVID-19 continues to disrupt supply chains and consumer habits, every opportunity to improve the visibility of your business will go a long way towards staying resilient. Now is the time to leverage tools like Power BI to unlock the true value of your data
At Optimising IT, our personalised Microsoft Power BI Consulting Services are the perfect solution to help you make sense of your data and business intelligence. Work with Optimising IT to gain a better understanding of the data for your business operations, customers, sales and revenue. Contact our team to learn how to use Power BI to discover invaluable business insights.
You can also follow our blog to discover more guides to Power BI for beginners.